
Solar Panel ROI & Payback Period in India: 25-Year Savings Analyzed
FreeSolar Financial Analysis Desk · 20 Sep 2026 · 20 min read
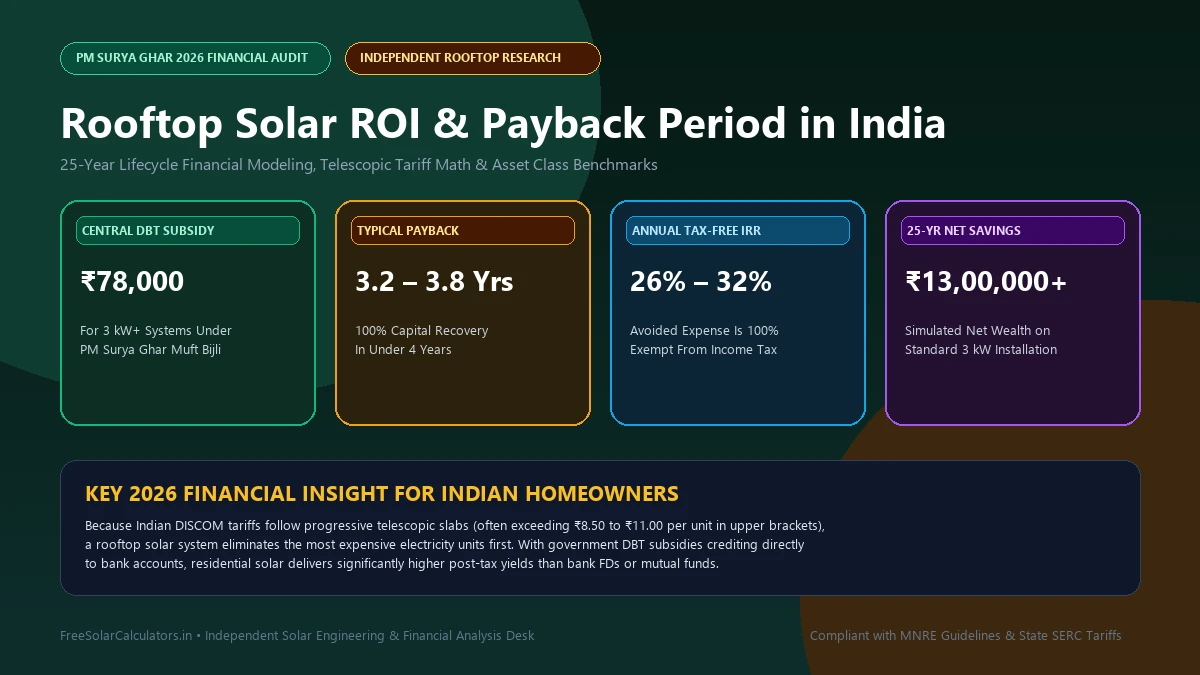
Simulate your exact payback period (typically 3.2 to 4.2 years) and 25-year cumulative wealth creation.
Residential rooftop solar is one of the highest-yielding, lowest-risk financial capital investments available to Indian homeowners today. Delivering an annual tax-free internal rate of return (IRR) between 24% and 34%, a quality rooftop solar installation significantly outperforms traditional wealth accumulation instruments in India, including bank Fixed Deposits (6.5% to 7.5% taxable), Public Provident Fund (7.1%), and equity mutual funds (12% to 14% volatile before long-term capital gains tax).
With the central government's PM Surya Ghar Muft Bijli Yojana providing a direct cash benefit transfer (DBT) subsidy of ₹78,000 for systems of 3 kW and above, the payback period on rooftop solar in India has plummeted to an all-time low of 3.2 to 3.8 years.
To understand why rooftop solar produces such extraordinary financial returns, one must look beyond environmental considerations and examine the engineering economics: how state electricity board tariff slabs compound, how solar degradation curves behave over a quarter of a century, and why avoided household expenditure carries a powerful structural tax exemption under the Indian Income Tax Act.
This comprehensive whitepaper models the complete 25-year financial trajectory of rooftop solar in India, accounting for panel degradation, utility tariff inflation, inverter replacement buffers, and state-by-state net metering regulations.
To calculate your personalized numbers based on your latest electricity bill, you can test your scenario directly using our interactive Solar ROI & Payback Calculator and our Solar Savings Calculator.
1. Capital Cost & PM Surya Ghar Subsidy Economics (1 kW to 10 kW Benchmark)
The economics of rooftop solar begin with turnkey installation costs. In 2026, benchmark pricing for residential rooftop solar has stabilized thanks to expanded domestic cell manufacturing under the Approved List of Models and Manufacturers (ALMM) maintained by the Ministry of New and Renewable Energy (MNRE).
Under the official National Portal for PM Surya Ghar Muft Bijli Yojana, residential consumers receive fixed central financial assistance:
- 1 kW System: ₹30,000 flat DBT subsidy.
- 2 kW System: ₹60,000 flat DBT subsidy (₹30,000 per kW).
- 3 kW to 10 kW Systems: ₹78,000 flat DBT subsidy (capped at 3 kW for individual residential connections).
The following benchmark table details prevailing 2026 turnkey capital expenditure (CapEx) across India, using Tier-1 ALMM List-1 certified monocrystalline or N-Type TOPCon panels, grid-tied string inverters, hot-dip galvanized mounting structures, ACDB/DCDB protection boxes, and dual-layer chemical earthing:
| System Capacity (kW) | Average Monthly Generation | Gross Turnkey Cost | Central DBT Subsidy | Net Out-of-Pocket Cost | Estimated Annual Electricity Savings |
|---|---|---|---|---|---|
| 1 kW | 120 – 135 kWh | ₹65,000 – ₹72,000 | ₹30,000 | ₹35,000 – ₹42,000 | ₹10,800 – ₹13,200 / yr |
| 2 kW | 240 – 270 kWh | ₹1,25,000 – ₹1,38,000 | ₹60,000 | ₹65,000 – ₹78,000 | ₹22,500 – ₹27,500 / yr |
| 3 kW (Most Popular) | 360 – 410 kWh | ₹1,75,000 – ₹1,95,000 | ₹78,000 | ₹97,000 – ₹1,17,000 | ₹34,500 – ₹42,000 / yr |
| 4 kW | 480 – 540 kWh | ₹2,25,000 – ₹2,50,000 | ₹78,000 (Capped) | ₹1,47,000 – ₹1,72,000 | ₹46,000 – ₹55,000 / yr |
| 5 kW | 600 – 680 kWh | ₹2,75,000 – ₹3,05,000 | ₹78,000 (Capped) | ₹1,97,000 – ₹2,27,000 | ₹58,000 – ₹70,000 / yr |
| 10 kW | 1,200 – 1,350 kWh | ₹5,10,000 – ₹5,60,000 | ₹78,000 (Capped) | ₹4,32,000 – ₹4,82,000 | ₹1,20,000 – ₹1,48,000 / yr |
Note: In addition to the central DBT subsidy, progressive state governments offer top-up subsidies. For instance, in Uttar Pradesh, the state government provides an additional top-up of up to ₹30,000 under the state solar policy, further reducing the net out-of-pocket investment for homeowners.
To check exact hardware component costs and price-per-watt breakdowns for different module types, consult our live Solar Panel Price List 2026 or estimate your full balance-of-system cost with our Solar Panel Cost Calculator.
2. The Telescopic Electricity Tariff Math: Why Solar Delivers High Returns
To understand why rooftop solar delivers an annualized return exceeding 26%, one must examine the billing structure used by Indian electricity distribution companies (DISCOMs).
Virtually every state electricity regulatory commission (SERC) mandates a telescopic slab tariff system for domestic residential consumers. Under this progressive pricing structure, your per-unit electricity rate increases significantly as your monthly consumption climbs:
- Tier 1 (0 – 100 Units): ₹3.50 to ₹4.50 per unit (heavily cross-subsidized baseline).
- Tier 2 (101 – 300 Units): ₹5.50 to ₹7.50 per unit.
- Tier 3 (301 – 500 Units): ₹8.00 to ₹10.50 per unit.
- Tier 4 (Above 500 Units): ₹10.50 to ₹13.50+ per unit (prevalent across high-tariff DISCOMs in Maharashtra, Delhi, West Bengal, and Karnataka).
How Solar Eliminates the Most Expensive Units First
When you connect a grid-tied solar system with bi-directional net metering, solar generation does not offset your cheapest electricity units first. Instead, it knocks off your highest, most punitive tariff slabs from the top down.
Consider an urban household consuming 500 units per month during the summer. Under standard telescopic billing, the first 100 units cost roughly ₹4.00, the next 200 units cost ₹6.50, and the top 200 units are billed at ₹9.80 per unit, plus fuel surcharge adjustments (FCA) and electricity duty (typically 9% to 16%).
When a 3 kW solar system generates 360 units in that month:
- The entire top slab of 200 units at ₹9.80 is completely eliminated.
- An additional 160 units in the middle slab at ₹6.50 are zeroed out.
- The household is left paying only for the heavily subsidized lower slab units.
Telescopic Slab Avoided Cost Breakdown:
Monthly Avoided Cost = (200 units × ₹9.80) + (160 units × ₹6.50) + Taxes = ₹3,004 + ₹480 = ₹3,484 per month
Annual Value of Generation = ₹3,484 × 12 months = ₹41,808 in Year 1
You can simulate how your own DISCOM bill scales across different consumption slabs using our interactive Solar vs Grid Calculator and the dedicated PM Surya Ghar Subsidy Calculator.
3. Payback Period Calculation: Line-Item 3 kW & 5 kW Case Studies
Let us examine the exact mathematical breakdown of the simple payback period for an average Indian middle-class home installing a standard 3 kW on-grid setup versus a larger 5 kW setup.
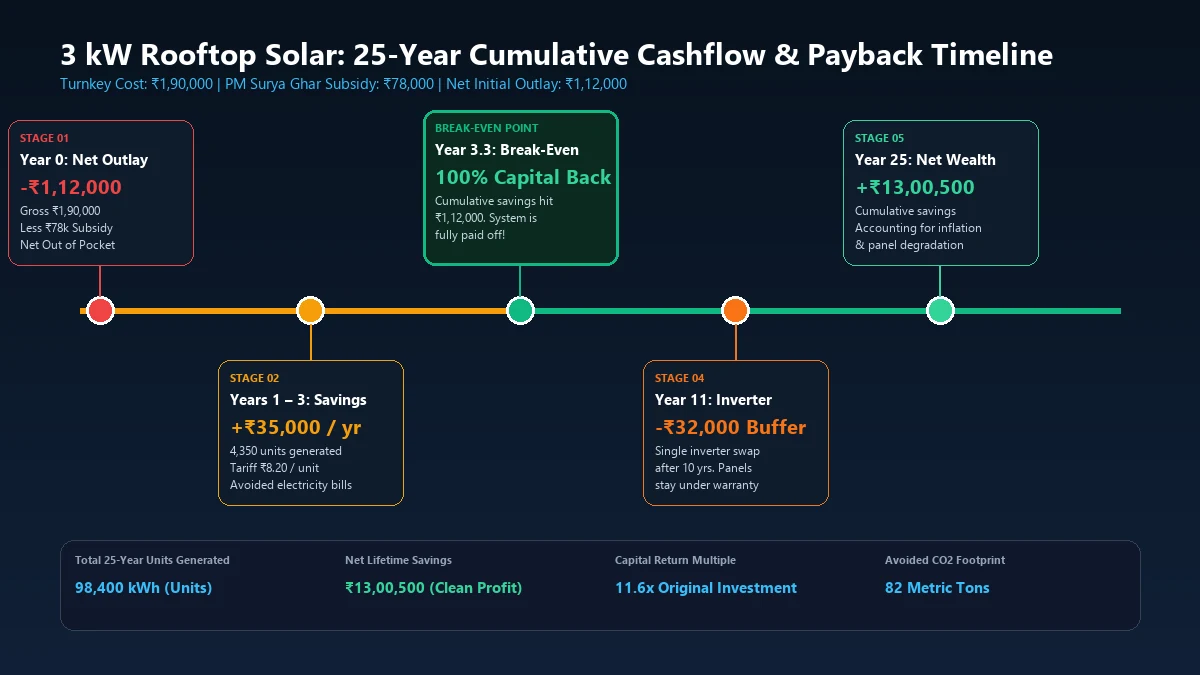
Case Study A: The 3 kW Residential System (Benchmark)
A 3 kW solar array requires approximately 6 high-efficiency 540W or 550W panels and occupies roughly 180 to 220 square feet of shadow-free rooftop space.
- Gross Turnkey Project Cost: ₹1,90,000
- Less Central PM Surya Ghar DBT Subsidy: -₹78,000
- Net Initial Capital Outlay: ₹1,12,000
- Annual Electricity Generation: 4,350 units (kWh) per year (~4 units/kW/day under typical Indian conditions)
- Effective Avoided Grid Tariff: ₹8.20 per unit (blended rate including duties)
- Gross Year 1 Financial Savings: 4,350 units × ₹8.20 = ₹35,670
- Less Routine Operations & Maintenance (Cleaning): -₹1,500
- Net Year 1 Cash Savings: ₹34,170
Simple Payback Period Calculation:
Payback Period = Net Capital Cost ÷ Year 1 Net Cash Savings
₹1,12,000 ÷ ₹34,170 = 3.28 Years (approx. 3 Years, 3 Months)
In approximately 3 years and 3 months, 100% of the capital invested has been returned to the homeowner's bank account through avoided electricity bills. For the remaining 21+ years of warrantied operation, the system produces virtually free electricity.
Case Study B: The 5 kW Residential System (For Heavy Appliance / AC Households)
For larger independent homes running multiple air conditioners (such as analyzed in our Solar Panels for 1.5 Ton AC Guide) and an electric vehicle charger:
- Gross Turnkey Project Cost: ₹2,85,000
- Less Central PM Surya Ghar DBT Subsidy: -₹78,000 (capped maximum)
- Net Initial Capital Outlay: ₹2,07,000
- Annual Electricity Generation: 7,250 units (kWh) per year
- Effective Avoided Grid Tariff: ₹8.80 per unit (higher average tariff due to heavy consumption bracket)
- Gross Year 1 Financial Savings: 7,250 units × ₹8.80 = ₹63,800
- Less Annual Maintenance: -₹2,500
- Net Year 1 Cash Savings: ₹61,300
5 kW Payback Period Calculation:
₹2,07,000 ÷ ₹61,300 = 3.37 Years (approx. 3 Years, 4 Months)
Even with the subsidy cap of ₹78,000 applied to systems above 3 kW, a 5 kW installation achieves full capital recovery in under 3.4 years because it displaces ultra-expensive peak tariff units.
4. 25-Year Cumulative Cashflow & Financial Modeling
A sound financial model must be built on conservative, real-world engineering assumptions rather than theoretical ideals. Over a 25-year lifespan, four critical operational parameters dictate net profitability:
- Photovoltaic Cell Degradation: Tier-1 N-Type TOPCon and Mono PERC modules experience roughly 1.0% degradation in Year 1, followed by a linear degradation of 0.40% to 0.50% per year thereafter. At Year 25, the system still operates at over 87.4% of its original rated output, as detailed in our guide on TOPCon vs Mono PERC vs Bifacial Solar Panels.
- Utility Tariff Escalation: Historical data across Indian state DISCOMs confirms that retail domestic electricity tariffs rise at an average compound annual growth rate (CAGR) of 3.5% to 5.0%, driven by rising coal handling fees, transmission grid augmentations, and general inflation. We apply a conservative 4.0% annual tariff escalation rate.
- Mid-Life Inverter Replacement Buffer: Solar panels carry a 25-year performance warranty, but modern grid-tied string inverters have a practical design life of 10 to 12 years. Our model includes a full inverter replacement expense of ₹32,000 in Year 11.
- Routine Cleaning & Maintenance: A recurring allowance of ₹1,500 per year (escalating at 3% annually) is budgeted for cleaning wiper supplies, water hose maintenance, and bi-annual technician inspections.
25-Year Lifecycle Cashflow Projection (3 kW Installation)
| Five-Year Milestone | Annual Solar Output | Prevailing Grid Tariff | Annual Net Cash Savings | Cumulative Net Profit |
|---|---|---|---|---|
| Year 1 | 4,350 kWh | ₹8.20 / unit | ₹34,170 | -₹77,830 (Net Outlay Recovering) |
| Year 3 | 4,307 kWh | ₹8.87 / unit | ₹36,700 | -₹3,500 (Near Break-Even) |
| Year 4 | 4,285 kWh | ₹9.22 / unit | ₹38,010 | +₹34,510 (Full Net Profit Begins) |
| Year 5 | 4,264 kWh | ₹9.59 / unit | ₹39,390 | +₹73,900 |
| Year 10 | 4,158 kWh | ₹11.67 / unit | ₹46,820 | +₹2,92,400 |
| Year 11 (Inverter Swap) | 4,137 kWh | ₹12.14 / unit | ₹16,220 (Net of ₹32k Inverter) | +₹3,08,620 |
| Year 15 | 4,055 kWh | ₹14.20 / unit | ₹55,780 | +₹5,38,100 |
| Year 20 | 3,954 kWh | ₹17.27 / unit | ₹66,280 | +₹8,49,300 |
| Year 25 | 3,856 kWh | ₹21.01 / unit | ₹78,810 | +₹13,00,500 (Lifetime Net Profit) |
Financial Performance Summary
- Initial Capital Invested (Post-Subsidy): ₹1,12,000
- Total Clean Units Generated (25 Years): ~98,400 kWh
- Cumulative Avoided Utility Bills: ₹14,05,000
- Less Cumulative Operations, Inverter & Upkeep: -₹1,04,500
- Net Lifetime Financial Profit: ₹13,00,500
- Capital Return Multiple: 11.6x Original Investment
- Internal Rate of Return (IRR): 28.4% Annualized (Tax-Free)
5. Asset Class Comparison: Solar vs Bank Fixed Deposits vs Mutual Funds
To evaluate whether rooftop solar makes financial sense, investors must compare it against standard wealth creation instruments in the Indian market.
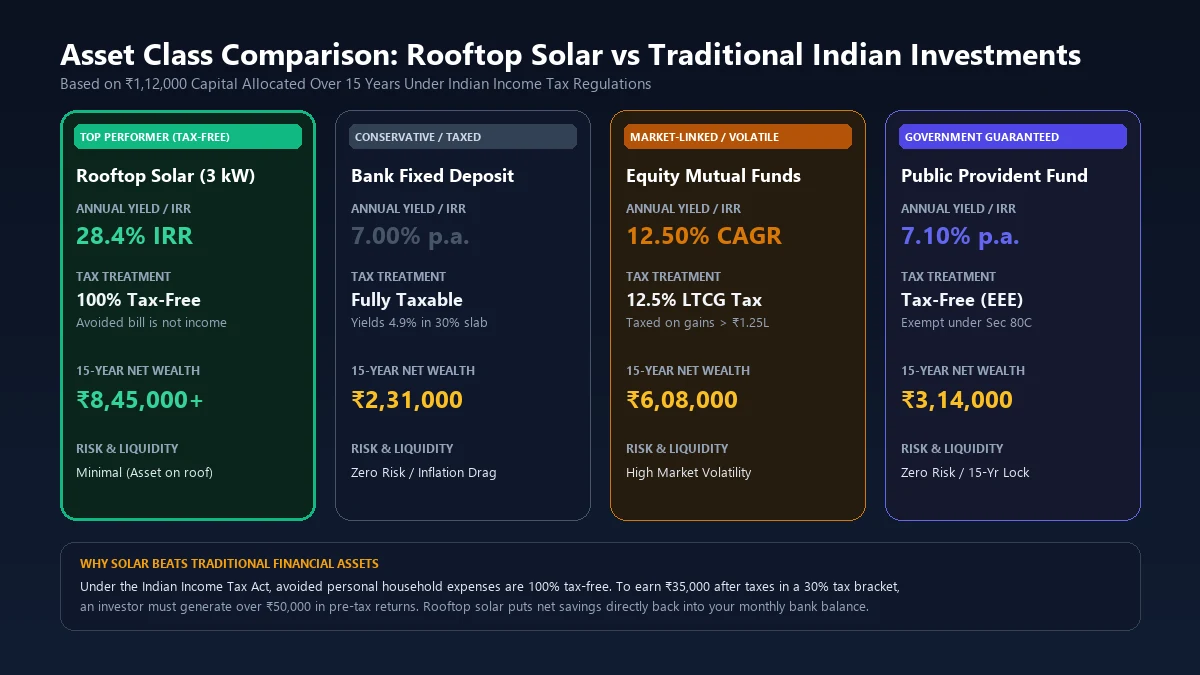
Here is a side-by-side comparison of allocating ₹1,12,000 into four popular asset classes over a 15-year horizon:
| Investment Class | Capital Invested | Nominal Annual Return | Tax Treatment of Returns | 15-Year Net Wealth Created | Risk Profile & Volatility |
|---|---|---|---|---|---|
| Bank Fixed Deposit (FD) | ₹1,12,000 | 7.00% p.a. | Fully Taxable at slab rate (yields 4.9% in 30% slab) | ₹2,31,000 | Very low capital risk, but suffers real inflation drag |
| Public Provident Fund (PPF) | ₹1,12,000 | 7.10% p.a. | Tax-Free (EEE) under Section 80C | ₹3,14,000 | Zero capital risk, but strict 15-year illiquid lock-in |
| Equity Mutual Funds (Flexi-cap) | ₹1,12,000 | 12.50% CAGR | 12.5% LTCG Tax on gains above ₹1.25 Lakh | ₹6,08,000 | High market volatility, periodic 20% to 30% drawdowns |
| Rooftop Solar (3 kW Grid-Tied) | ₹1,12,000 | 28.40% IRR | 100% Tax-Free (Avoided household expenditure) | ₹8,45,000+ | Minimal risk, tangible physical asset on your own terrace |
Over a 15-year comparison window, rooftop solar generates nearly four times the net wealth of a bank Fixed Deposit and outperforms historical equity mutual fund returns by over 38%, while carrying none of the stock market drawdown risks associated with equity investments.
6. The Indian Income Tax Advantage: Why Avoided Expenses Beat Pre-Tax Returns
The single most overlooked financial feature of rooftop solar is its favorable tax status under the Indian Income Tax Act.
Under Indian tax jurisprudence, money saved by avoiding personal domestic expenditure does not constitute taxable income.
To illustrate why this creates an enormous financial multiplier:
- Suppose an investor earns ₹35,000 per year in interest from a bank Fixed Deposit. If the investor falls in the 30% income tax slab (plus surcharge and cess totaling 31.2%), the government withholds ₹10,920 in income tax. The net cash remaining in hand is only ₹24,080.
- To generate ₹35,000 in net, post-tax spendable cash from bank deposits, an individual in the 30% bracket would need to earn over ₹50,800 in pre-tax returns, requiring a fixed deposit capital allocation of roughly ₹7,25,000!
- In contrast, when your rooftop solar array eliminates ₹35,000 from your annual electricity bill, every single rupee of that ₹35,000 remains in your disposable cash balance. There is zero tax deduction at source (TDS), zero capital gains liability, and zero reporting requirement on your annual ITR.
This structural tax immunity makes residential solar one of the few legal instruments in India that yields high double-digit post-tax returns.
7. State-by-State Payback Benchmarks Across India
Because solar irradiation and state DISCOM tariff policies differ across the country, payback periods vary by region. The table below illustrates actual 3 kW grid-tied payback timelines across major Indian states:
| State | Primary DISCOMs | Solar Irradiance (kWh/m²/day) | Average High-Slab Tariff | Central + State Subsidy | Estimated Payback Period |
|---|---|---|---|---|---|
| Maharashtra | MSEDCL, Adani Electricity, Tata Power | 5.2 – 5.6 | ₹10.50 – ₹12.80 / unit | ₹78,000 | 2.8 – 3.2 Years |
| Gujarat | DGVCL, MGVCL, PGVCL, UGVCL, Torrent | 5.5 – 6.0 | ₹7.80 – ₹9.20 / unit | ₹78,000 | 3.1 – 3.5 Years |
| Uttar Pradesh | UPPCL (DVVNL, MVVNL, PVVNL, PuVVNL) | 4.8 – 5.3 | ₹7.50 – ₹8.80 / unit | ₹78,000 + ₹30,000 State | 2.6 – 3.0 Years |
| Rajasthan | JVVNL, AVVNL, JdVVNL | 5.8 – 6.3 | ₹8.20 – ₹9.50 / unit | ₹78,000 | 3.0 – 3.4 Years |
| Karnataka | BESCOM, MESCOM, HESCOM, GESCOM | 5.2 – 5.6 | ₹8.50 – ₹9.80 / unit | ₹78,000 | 3.2 – 3.6 Years |
| Tamil Nadu | TANGEDCO | 5.4 – 5.8 | ₹7.20 – ₹8.60 / unit | ₹78,000 | 3.4 – 3.9 Years |
| Madhya Pradesh | MPPKVVCL, MPMKVVCL | 5.3 – 5.7 | ₹8.00 – ₹9.40 / unit | ₹78,000 | 3.2 – 3.6 Years |
| Delhi | BRPL, BYPL, TPDDL | 4.9 – 5.3 | ₹8.00 – ₹10.20 / unit | ₹78,000 + Solar Policy Rebate | 2.9 – 3.3 Years |
| Haryana | DHBVN, UHBVN | 5.0 – 5.4 | ₹7.50 – ₹8.50 / unit | ₹78,000 | 3.3 – 3.7 Years |
| West Bengal | WBSEDCL, CESC | 4.6 – 5.0 | ₹9.20 – ₹11.50 / unit | ₹78,000 | 3.2 – 3.6 Years |
You can explore comprehensive local regulations, DISCOM interconnection guidelines, and state-specific policies on our dedicated state portals:
- Maharashtra Rooftop Solar Guide
- Gujarat Solar Policy & Slabs
- Uttar Pradesh Solar Subsidy & Net Metering
- Rajasthan Solar Irradiance & Sizing
- Karnataka Solar Net Metering Rules
8. Solar Financing Economics: Low-Interest PM Surya Ghar Bank Loans
Many homeowners prefer not to pay the upfront capital cost entirely out of pocket. Under the PM Surya Ghar framework, the Ministry of Finance has partnered with nationalized public sector banks to provide specialized, collateral-free solar financing.
Major institutions offering preferential rooftop solar loans include:
- State Bank of India (SBI Surya Ghar Scheme): 7.00% p.a. interest rate for systems up to 3 kW.
- Bank of Baroda: 7.10% p.a. for tenures up to 120 months (10 years).
- Punjab National Bank (PNB): 7.00% to 7.15% p.a.
- Canara Bank: 7.10% p.a.
Loan Cashflow Analysis: Why Solar is Self-Financing
Consider a 3 kW system financed through an SBI rooftop solar loan at 7.0% per annum over a 7-year tenure:
- Gross Project Cost: ₹1,90,000
- Government DBT Subsidy: ₹78,000 (credited directly into the loan account upon DISCOM commissioning)
- Net Loan Principal After Subsidy: ₹1,12,000
- Monthly Loan EMI (7 Years @ 7.0%): ₹1,691 per month
- Average Monthly Electricity Bill Savings: ₹2,847 per month
- Net Immediate Monthly Cash Surplus: +₹1,156 per month
Under this financing structure, the solar system is immediately cash-flow positive from Day 1. The money saved on your electricity bill is more than enough to cover the monthly bank EMI, leaving you with extra cash in hand every month. Once the 7-year loan is fully paid off, the entire bill savings flow directly into your pocket for the next 18 years.
To calculate exact loan payments across different down payment amounts and tenures, use our Solar Loan EMI Calculator.
9. Real-World Risk Factors: Degradation, Soiling, and DISCOM Net Metering
While the financial return of rooftop solar is extraordinarily compelling, achieving the projected 26% to 32% IRR requires managing three real-world operational risks:
1. Terrace Shadow Obstructions
Solar panels connected in series strings behave like a garden hose: if one panel is shaded by a neighboring water tank, staircase mumty, or tree, the current through the entire electrical string drops. Prior to installation, insist on a comprehensive shadow path analysis for the winter solstice (when shadows are longest).
2. Dust Soiling and Cleaning Frequency
In Indian urban environments with high airborne particulate matter (PM2.5 and PM10), accumulated dust and dirt can reduce module power output by 8% to 15% within three to four weeks. Cleaning panels with plain water every 15 to 20 days early in the morning or late in the evening restores generation efficiency completely.
3. Grid Blackouts and Inverter Architecture
A standard on-grid system requires an active grid voltage signal to function (mandated by anti-islanding safety regulations). If your locality suffers from frequent daily blackouts exceeding 2 to 3 hours, an on-grid system will shut down during those outage windows, reducing your total daily unit generation. Homeowners in areas with unstable power should consider a hybrid setup, as detailed in our comprehensive guide on On-Grid vs Off-Grid vs Hybrid Solar Systems.
10. Summary Checklist: How to Maximize Your Rooftop Solar ROI
If you are planning to install rooftop solar in 2026, follow this practical checklist to ensure you achieve the shortest possible payback period and maximum 25-year financial returns:
- Verify ALMM Certification: Ensure your solar panels are listed on ALMM List-1 and manufactured using Domestic Content Requirement (DCR) cells to guarantee eligibility for the ₹78,000 PM Surya Ghar subsidy.
- Size for 90% to 100% of Annual Consumption: Avoid oversizing your system beyond your contracted sanction load. Most Indian DISCOMs cap rooftop solar capacity at 80% to 100% of your sanctioned load, and surplus units exported at the end of the settlement year are purchased at a lower average power purchase cost (APPC) rather than the retail tariff.
- Select High-Efficiency N-Type TOPCon Panels: Modern TOPCon modules deliver 22% to 22.8% cell efficiency and feature a superior temperature coefficient (-0.30%/°C) compared to older Mono PERC panels, generating 4% to 6% more units during blistering Indian summers.
- Demand Dual-Layer Chemical Earthing & SPD Protection: Insist on dedicated earthing pits for DC, AC, and Lightning Arrestor circuits, along with Class-II Surge Protection Devices (SPD) inside the distribution boxes to protect your inverter against monsoon voltage spikes.
- Get Transparent EPC Quotes: Compare turnkey installation proposals from multiple accredited solar vendors to verify balance-of-system (BOS) warranties and net-metering liaison fees.
Ready to see how much you can save? Start by running your latest electricity bill through our Solar Panel Calculator and discover your exact payback period today.
Calculate your own numbers
Model your rooftop capacity, subsidy eligibility, and payback periods using our specialized calculators.
Solar ROI Calculator India: Return & Payback Period
Simulate your exact payback period (typically 3.2 to 4.2 years) and 25-year cumulative wealth creation.
Solar Savings Calculator India: Electricity Bill Savings
Compare cumulative 25-year solar power savings against rising DISCOM utility tariffs.
Solar vs Grid Electricity Cost Calculator India
Calculate your exact numbers with official 2026 solar engineering formulas.
Frequently asked questions
What is the typical payback period for rooftop solar in India under PM Surya Ghar Yojana?
For a standard residential 3 kW on-grid solar system in India, the simple payback period ranges from 3.2 to 3.8 years. With the direct central subsidy of ₹78,000 under PM Surya Ghar Muft Bijli Yojana, net investment drops to ₹1,05,000 to ₹1,20,000. Annual electricity savings of ₹34,000 to ₹38,000 recover the entire capital outlay before Year 4.
How does the financial ROI (IRR) of rooftop solar compare with bank Fixed Deposits and Mutual Funds?
Rooftop solar delivers an internal rate of return (IRR) of 26% to 32% annually, which is 100% tax-free because avoided household utility expenditure is not treated as taxable income under Indian tax laws. In contrast, bank FDs yield 6.5% to 7.5% before tax (falling to ~4.9% in the 30% tax bracket), and equity mutual funds average 12% to 14% historical CAGR subject to 12.5% LTCG tax and market volatility.
What happens to solar power generation and financial savings after 25 years?
Solar panels do not stop producing power after 25 years. Tier-1 monocrystalline and N-Type TOPCon panels are warrantied to retain at least 84% to 87.5% of their original generation efficiency at Year 25. The system continues generating clean electricity for decades beyond the initial warranty period with nominal upkeep.
How does net metering affect solar savings across different Indian states?
Under net metering regulations established by State Electricity Regulatory Commissions (SERCs), every unit of solar power exported during the day is credited against grid units consumed at night. In high-tariff states like Maharashtra, Gujarat, Uttar Pradesh, and Karnataka, solar offsets consumption in the highest tariff slabs (₹8 to ₹12 per unit), maximizing financial returns. Unconsumed banked surplus units are settled annually by DISCOMs at the prevailing average power purchase cost (APPC).
Do I need to budget for solar inverter replacement during the 25-year lifespan?
Yes. While high-grade solar modules have a 25-year linear performance warranty, grid-tied string inverters generally have an operating lifespan of 10 to 12 years. Realistic 25-year financial models budget a single inverter replacement around Year 11 (costing approximately ₹30,000 to ₹35,000 for a 3 kW system), which has already been factored into our net lifetime savings projection of ₹13,00,000+.
Can I finance a rooftop solar system through bank loans in India?
Yes. Major public sector banks including State Bank of India (SBI), Bank of Baroda, Punjab National Bank (PNB), and Canara Bank offer collateral-free rooftop solar loans under the PM Surya Ghar scheme at attractive interest rates of 7.0% to 7.15% per annum for tenures up to 10 years. In most cases, the monthly electricity bill savings exceed the loan EMI, making the system cash-flow positive from Month 1.
This technical guide is authored and audited against current Ministry of New & Renewable Energy (MNRE) guidelines, the National Portal for Rooftop Solar (pmsuryaghar.gov.in), Bureau of Indian Standards (BIS), and State Electricity Regulatory Commission (SERC) tariff schedules.
Disclaimer: Solar generation, net metering credits, and financial savings depend on local irradiation, terrace azimuth, and specific DISCOM net-metering regulations.
Related posts
PM Surya Ghar Solar Loan Rejections: Causes, District Magistrate Directives, and Step-by-Step Approval Solutions
Exhaustive legal and procedural guide on resolving PM Surya Ghar rooftop solar loan rejections: analyzing bank branch NPA fears, administrative review interventions by District Magistrates, RBI collateral-free lending caps, and step-by-step escalation protocols for rapid approval.
PM DHARA Scheme: ₹1.86 Lakh Crore Overhaul for India's Renewable Energy Grid & 50 GWh Battery Storage
Comprehensive technical breakdown of India's ₹1.86 lakh crore PM DHARA scheme: 135 GW transmission evacuation, 50 GWh BESS, ₹54,082 crore central assistance, and rooftop solar impact.